


NetApp, Nutanix and Pure have each announced quarterly results and their revenue histories present a revealing picture of their individual status, with the gap between flattish NetApp and growing Nutanix and Pure reducing.
We have drawn charts showing their quarterly revenues by fiscal year so that we can see both their overall revenue trend and the quarterly sequential trends as well. The NetApp chart numbers date from its fy2012 and show a fairly level wave-type formation with the dip periods narrowing – from a three-year one from fy2014 to fy2017, then a two-year one from fy2019 to fy 2021, and, thirdly, a two-quarter one in fy2024.
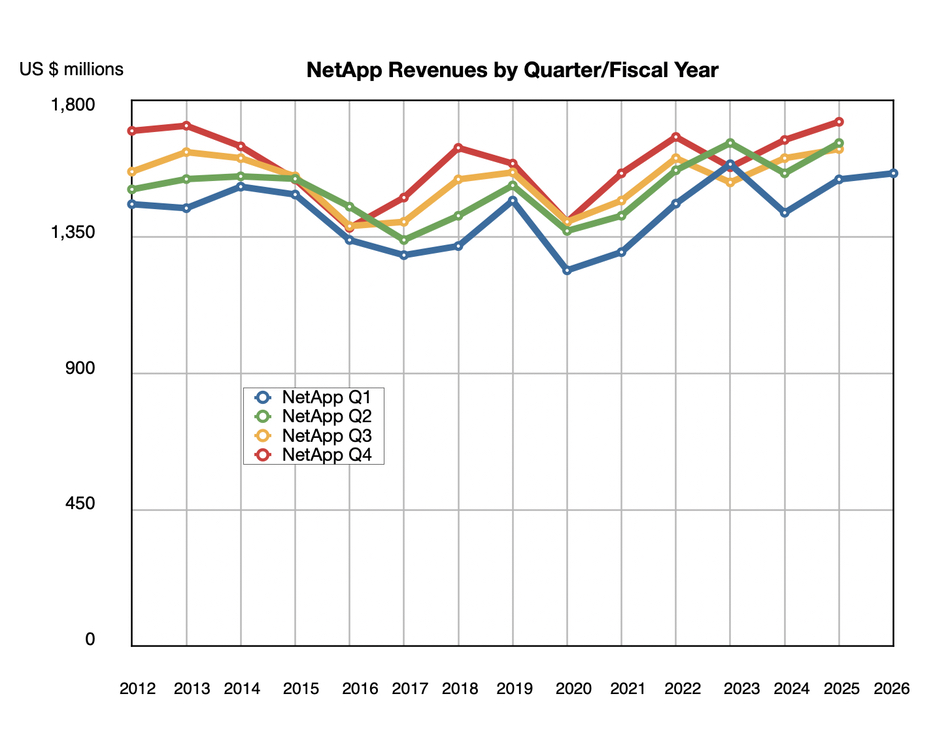
The company has good growth in some product lines, such as all-flash arrays (AFAs) but, overall, it’s a level-pegging and consistent cash-flow generating machine. The latest quarter exhibited 1 percent year-on-year growth to $1.56 billion.
Hyper-converged infrastructure (HCI) appliance business Nutanix is quite different:
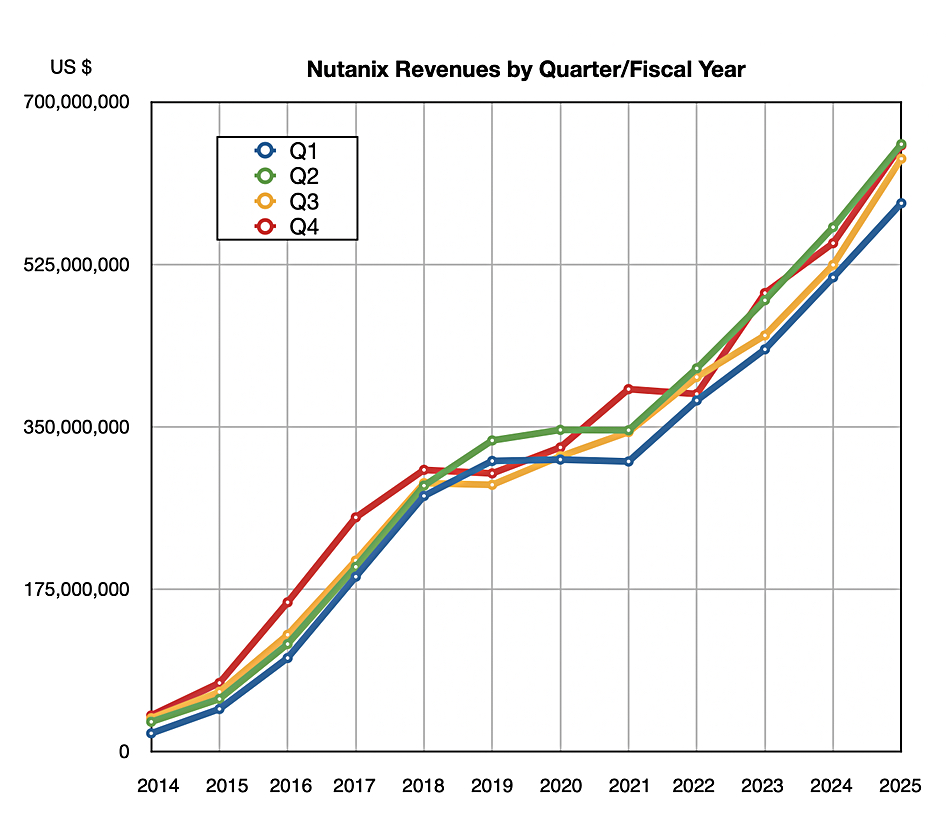
It’s a smaller company than NetApp, and it grew its revenues at a quite consistent high rate from 2015 to 2018 but then relapsed with level-pegging until fy2021 when revenue growth accelerated. Apart from a lapse in that year’s fourth quarter, growth has remained at a consistently high rate; it reported 18 percent year-on-year revenue growth in its latest quarter, to $653.3 million. Nutanix competes with Broadcom-owned VMware and also Dell’s hyper-converged products, but not directly with either NetApp or Pure.
The Pure Storage chart looks like this:
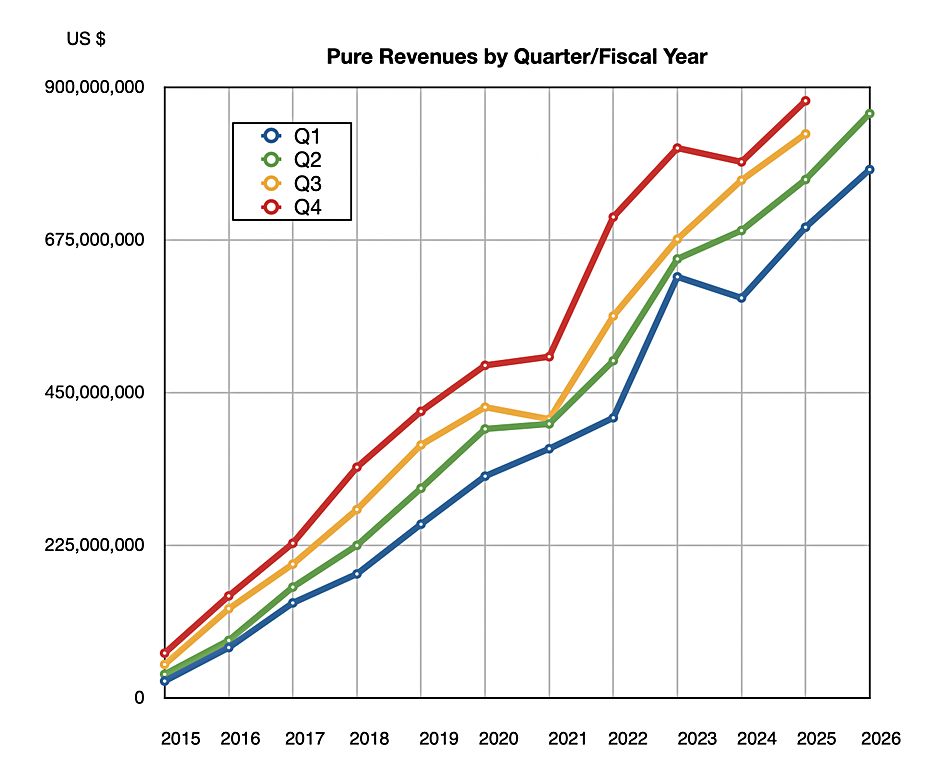
It’s another growth company and has suffered two growth missteps, in fy2021 and fy 2024. It recovered from both and regained double-digit growth, albeit not at the Nutanix level, as it increased revenue 13 percent Y/Y to $861 million in its latest quarter, Q2 fy2026.
Pure is focused on on-premises all-flash arrays and also has a public cloud block storage business. In contrast NetApp supplies disk, disk+flash, and all-flash arrays and has a stronger public cloud product presence. All-flash revenues in its latest quarter were $893 million, up 6 percent Y/Y, giving it the number one AFA market share position. It seems that Pure Storage is growing its AFA revenue faster than NetApp.
If we show the three supplier’s revenue history from NetApp’s Q3 fy2018 on a single chart this is what we find:
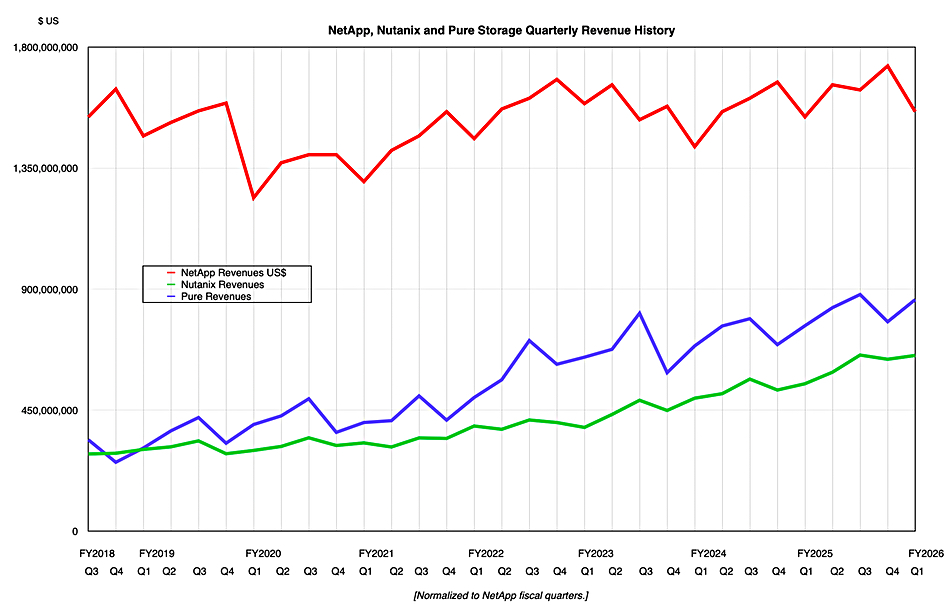
NetApp has a discernable overall growth trend from fy2020 onwards. Both Nutanix and Pure are growing faster than NetApp, with Pure having established a gap between itself and Nutanix. As a hyperconverged vendor, Nutanix represents a threat to both NetApp and Pure, since HCI customers will tend not to buy the external storage arrays they produce. However, Nutanix has recently provided support for external storage, such as Pure’s FlashArray, linked to its HCI software and this will lessen its threat to their sales.


